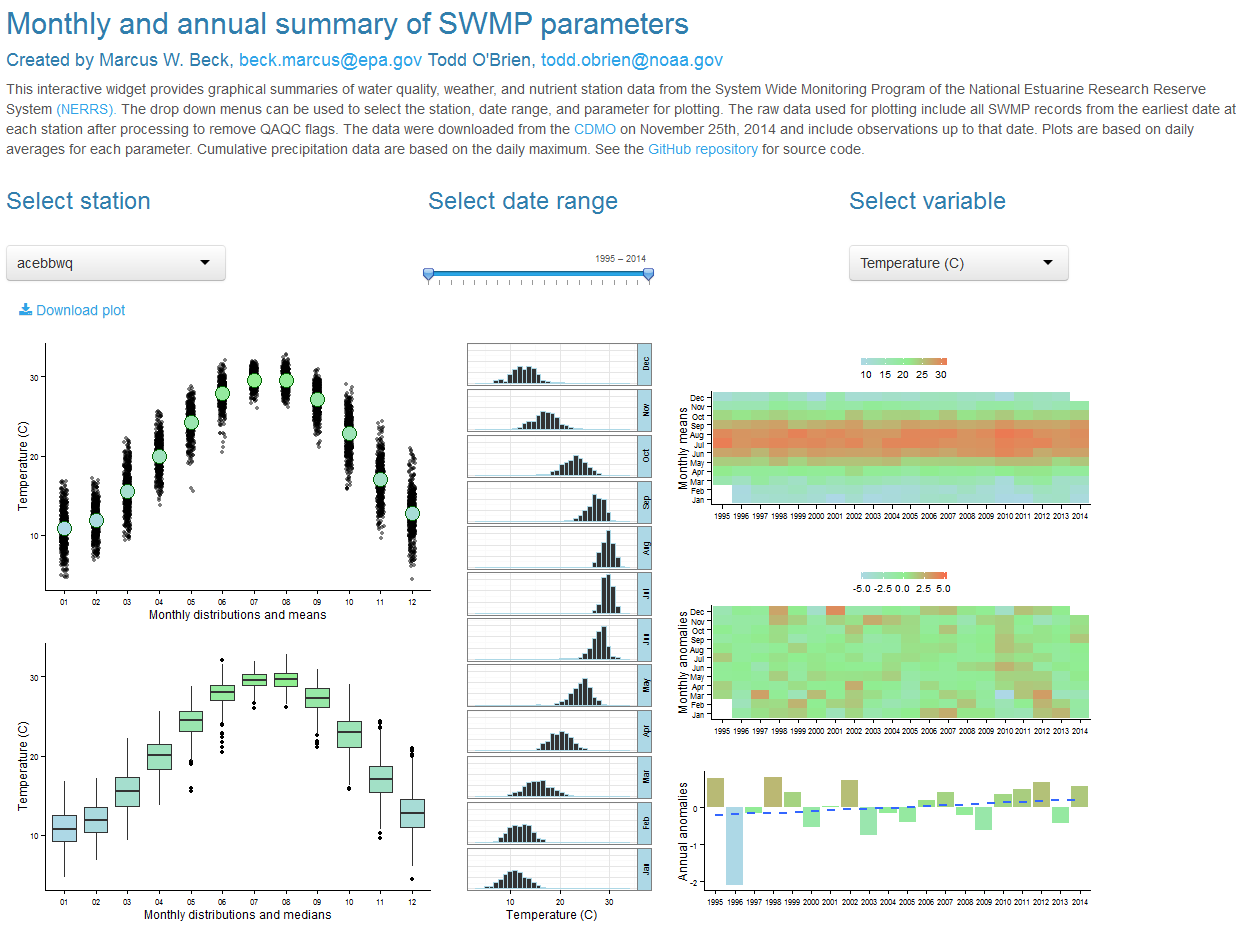
This interactive widget provides graphical summaries of water quality, weather, and nutrient station data from SWMP. The drop down menus can be used to select the station, date range, and parameter for plotting. The raw data used for plotting include all SWMP records from the earliest date at each station after processing to remove QAQC flags. The data were downloaded from the
cdmo.baruch.sc.edu/ on November 25th, 2014 and include observations up to that date. Plots are based on daily averages for each parameter. Cumulative precipitation data are based on the daily maximum.